
ID7000™ Spectral Cell Analyzer
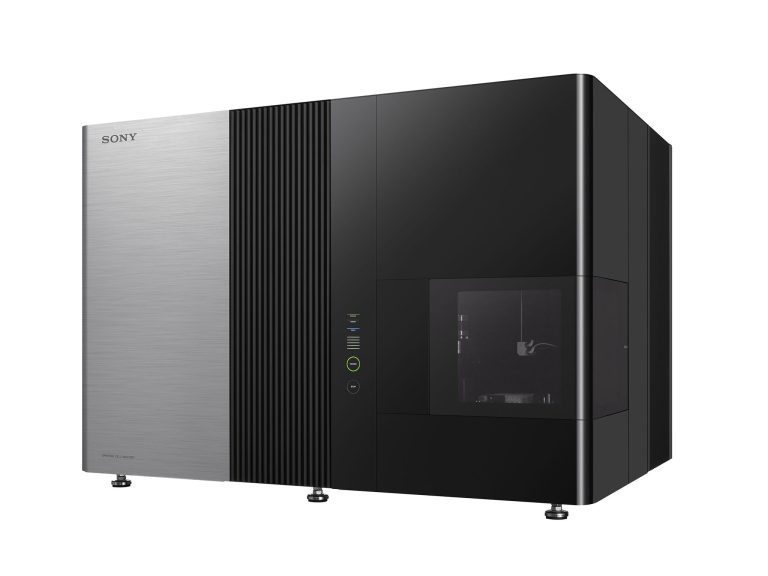
The ID7000™ spectral cell analyzer supports high-parameter flow cytometry by delivering comprehensive information about heterogeneous cell populations, with high sensitivity to detect dim and rare populations.
Expanding the capabilities of cell analysis, the ID7000 can be configured with up to 7 lasers and 186 detectors, the most of any flow cytometer available today. The system enables researchers to perform experiments using 44 colors or more, limited only by the fluorochromes available. Laser choices range from deep ultraviolet (320 nm) to infrared (808 nm). The system’s detection capability enables expansion of multicolor panels and can keep pace with future fluorochrome development.
The ID7000 spectral cell analyzer streamlines high-parameter experiments and multicolor workflows. Novel features, including the Spectral Reference Library, save time. The Autofluorescence Finder allows researchers to identify and subtract contributions to the signal from autofluorescent populations, thus ensuring higher fidelity of data and more accurate visualization.
Intuitive, guided workflows on the ID7000 spectral cell analyzer make multicolor flow cytometry accessible. Software wizards and tools simplify instrument controls from startup to shutdown, automate quality control, and optimize experiment creation. The standard AutoSampler provides walkaway operation and is equipped with a unique, active agitation capability to keep cells in suspension during sample acquisition.
Spectral technology, easy-to-use software, and automation across the workflow make the ID7000 an excellent fit for facilities looking for a user-friendly, high-performance analyzer that will bring their research to the next level.
For Research Use Only. Class 1 Laser Product. ID7000 is a trademark of Sony Corporation.
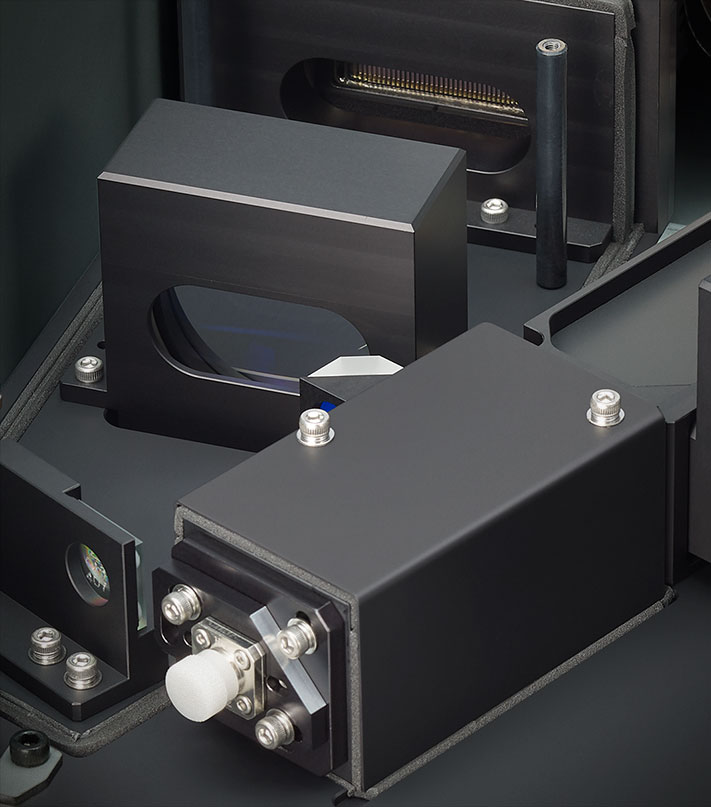
The advanced optics design, along with other proprietary technologies included in the ID7000 spectral system, provide best-in-class data so that researchers can collect the most information from every sample. Sony has developed signal processing technologies to reduce electronic noise, central to achieving high sensitivity in a flow cytometer. Together, these capabilities help to deliver the sensitivity to help scientists achieve more accurate results.
The new excitation and detection optics in the ID7000 allow users to select spectrally similar fluorochromes and resolve the signal with confidence, to gain a deeper understanding of cellular biology. As pioneers in spectral technology, we at Sony have designed the optics to unlock the full potential of spectral analysis, with an unparalleled number of lasers and PMT detectors that provide the resolution needed to unmix even the most similar spectral signatures.
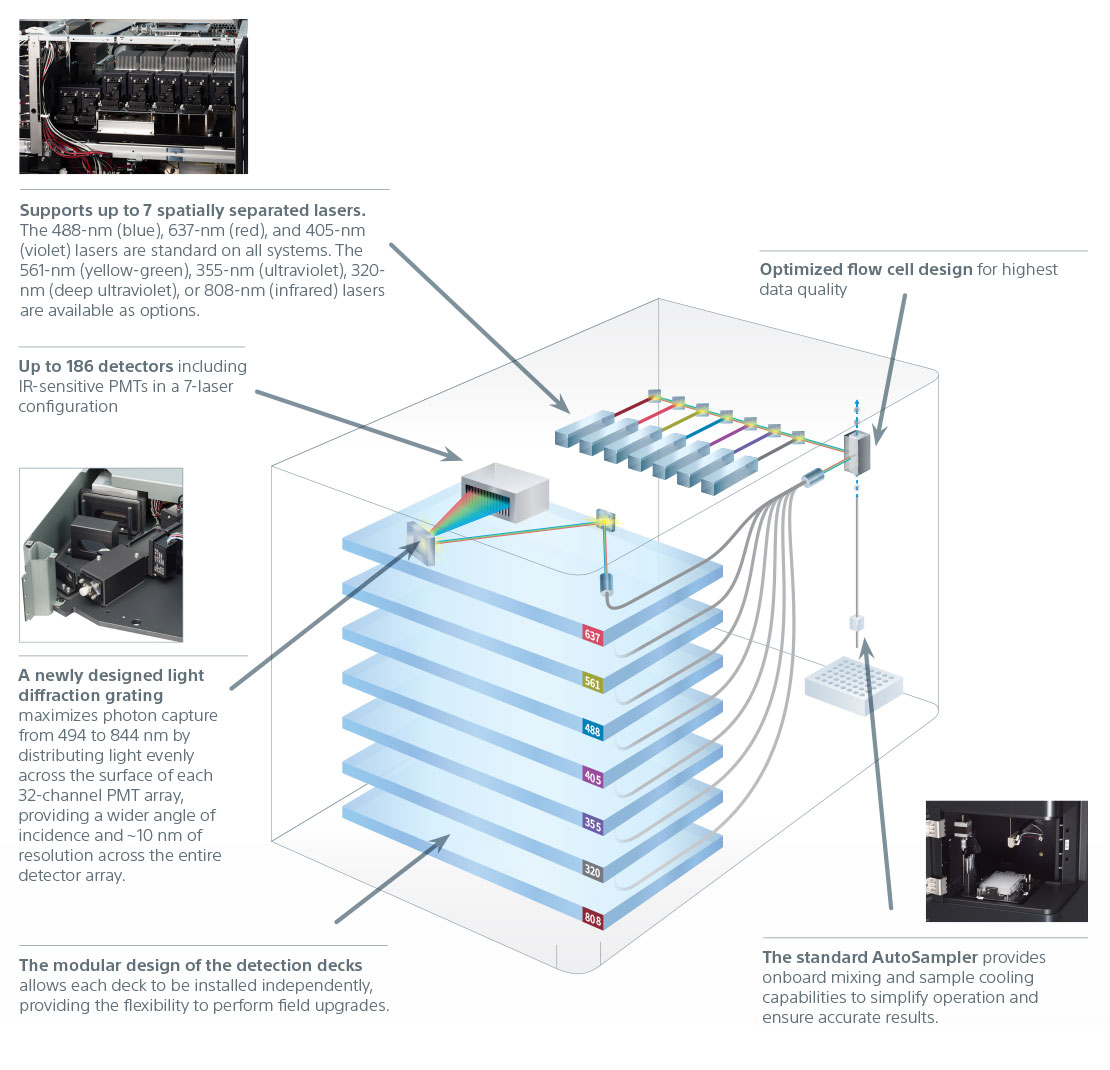
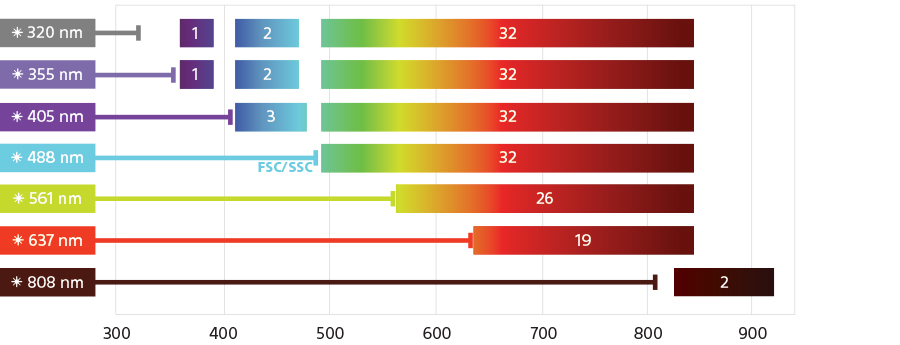
The excitation optics are designed to maximize fluorochrome excitation and emission across the detector array to deliver distinctly resolved populations. The system is equipped with three standard excitation lasers in all configurations: the 488-nm (blue), 637-nm (red), and 405-nm (violet) lasers. Optional 561-nm (yellow-green), 355-nm (ultraviolet), 320-nm (deep ultraviolet), or 808-nm (infrared) lasers support a wide variety of applications. Each excitation laser has power specifications optimized to deliver the highest performance for detecting dim and rare markers.
The expanded detector availability addresses the complexity of panel design, and in turn fluorochrome choices, which empowers discovery. Photomultiplier tubes (PMTs) have been chosen for their high signal-to-noise performance to capture the most photons, leading to higher resolution and lower background, enhancing dim signal detection for superior visualization of rare populations.
Emitted light is collected from 360 nm to 920 nm using PMTs (32-channel, single-channel, and single-channel IR-sensitive), and a spectral fingerprint is generated. A light diffraction grating based collection system maximizes photon capture across the entire spectrum by distributing light evenly across the surface of each of the 32-channel PMT arrays. This new, robust system provides high resolution across the entire detector array for a larger, more evenly distributed detection range, and minimizes light loss.
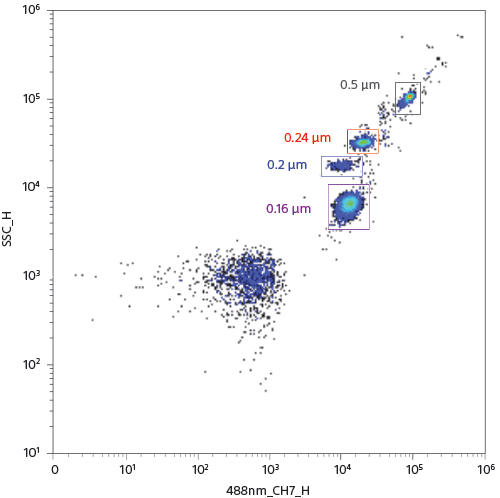
The ID7000 can detect small particles. The figure shows how a mix of fluorescent beads of varied diameters available as a commercial product (Megamix, Biocytex), is analyzed to clearly resolve the 160-nm beads from all other beads and separate from noise, using SSC and channel 7 of the 32-channel PMT array on the blue laser deck.
The ID7000 spectral cell analyzer builds on Sony’s experience with spectral analysis and simplifies many operations, even for complex experiments. With the true signal for each fluorochrome unaffected by autofluorescence or subjective adjustment of spillover, spectral analysis yields cleaner, unbiased data for every experiment.
In spectral analysis, signals from all detected channels are used to create one spectral emission signal, regardless of the number of fluorochromes analyzed. Unmixing, a powerful capability, then separates fluorophores into pure signals that measure the intensity of each fluorophore at each wavelength to more accurately measure data for analysis. The ID7000 uses the WLSM (Weighted Least Squares Method) fluorescence unmixing algorithm to separate the individual spectral fingerprints and enable scientists to analyze dim and rare phenotypic marker expression.
Unmixing delivers a more comprehensive picture of rare populations while decreasing the complexities associated with working with fluorescent proteins and fluorochromes excited by multiple lasers. Overall, spectral technology simplifies multicolor panel design by eliminating the use of bandpass filters and highly subjective, conventional compensation matrixes.
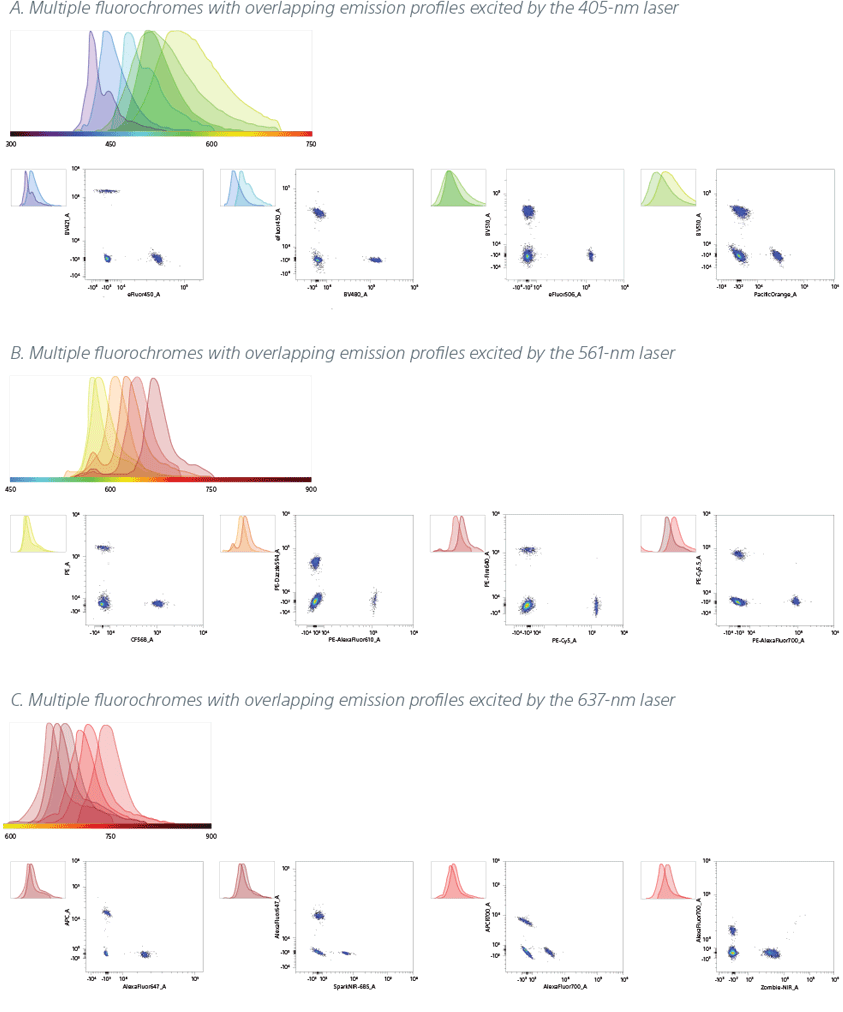
Compensation beads were stained with three different sets of fluorescent antibodies, and excited by the 405-nm, 561-nm, and 637-nm lasers as described below. Data was analyzed on the ID7000 spectral cell analyzer.
A. For the fluorochromes BV421/ eFluor™ 450/ BV480/ BV510/ eFluor™ 506/ Pacific Orange™ excited by the 405-nm laser, distinctly resolved emission peaks and populations were observed.
B. For the fluorochromes PE/ CF®568/ PE/Dazzle™ 594/ PE-Alexa Fluor® 610/ PE/FIRE™ 640/ PE-Cy™5/ PE-Cy™5.5/ PE-Alexa Fluor® 700 excited by the 561-nm laser, distinctly resolved emission peaks and populations were observed.
C. For the fluorochromes APC/ Alexa Fluor® 647/ Spark NIR™ 685/ APC-R700™/ Alexa Fluor® 700/ Zombie NIR™ excited by the 637-nm laser, distinctly resolved emission peaks and populations were observed.
Spectral analysis, while allowing researchers to see the full emission signal without using bandpass filters, also enables autofluorescence to be handled as a separate color. In conventional flow cytometry, cellular autofluorescence produced by pyridine (NAD/NADH), flavin (FMN, FAD), and other intracellular oxidative reactions can interfere with signals of other fluorescent markers. Other common sources of autofluorescence include cell fixation and permeabilization. Spectral technology subtracts one or more autofluorescent spectral fingerprints to allow researchers to see the true fluorescent populations.
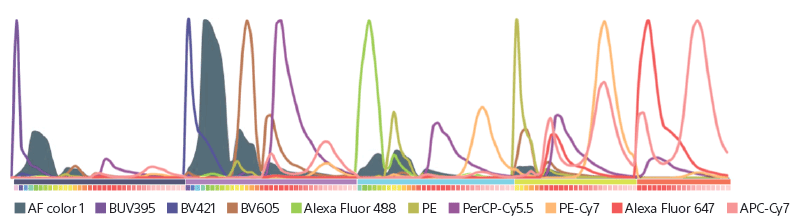
Spectral emission curves from a sample stained with nine fluorochromes are shown, as analyzed with a 5-laser ID7000 system. The cellular autofluorescence spectral curve can be seen along with the fluorescence spectral curves due to the nine fluorochromes used. The ability to distinguish the cellular fluorescence contribution independently from the signal due to the fluorochromes yields unbiased data.
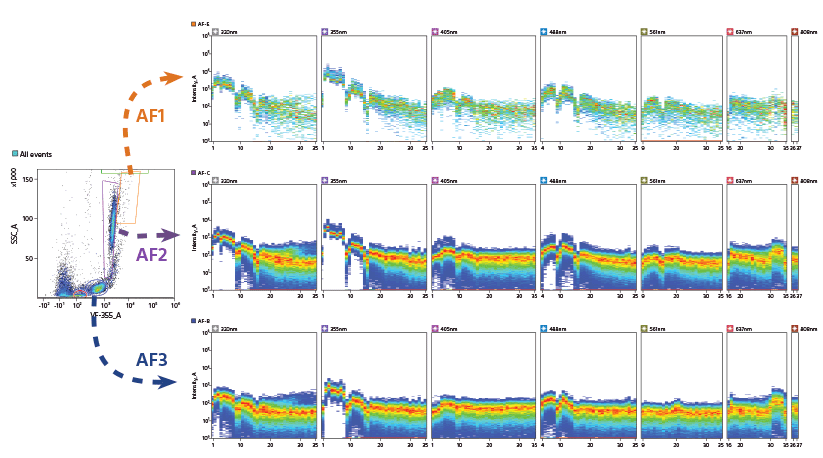
An unstained lysed whole blood sample was analyzed with the ID7000 cell analyzer to understand the contribution of cellular autofluorescence.
A. The figure shows spectral ribbon displays when studying the gated populations of lymphocytes, granulocytes, and eosinophils. Removing the signal due to this autofluorescence by using spectral fingerprints obtained in the analysis, increases the precision and quality of results.
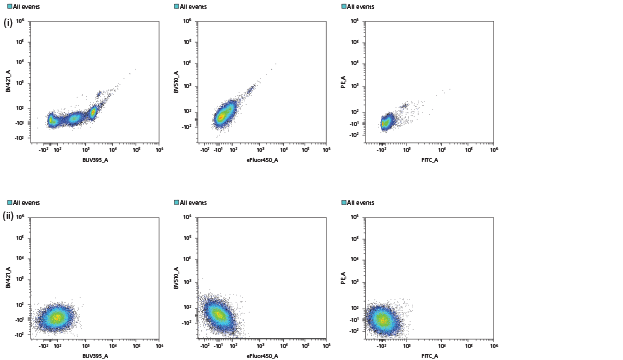
B. This figure shows the parametric display for the same samples. In the first row (i) the plots show presence of additional spurious populations as a result of intrinsic cellular autofluorescence. In the second row (ii) the autofluorescence subtraction is applied to remove contributions of AF1, AF2, and AF3, and the spurious populations are eliminated.
Users acquire single-color control data before experimental samples so that the unmixing algorithm has emission spectra inputs that it can reference to unmix the experimental sample. Single-color control spectra are stored in the Spectral Reference Library. Unlike compensation controls, spectral references do not need to be acquired for every new experiment and can be reused. This allows users to create a personal or shared reagent library that simplifies experiment creation, saves time and valuable reagents, and increases efficiency.
The ID7000 system can be operated in a Normal or Standardization mode. Standardization mode sets the system to an optimized master specification that allows researchers to maintain instrument settings between experiments and across multiple instruments to support longitudinal studies and cross-site collaboration. Standardization mode adjusts the output of each channel so that the SSC and fluorescence detection sensitivities are the same between multiple instruments.
PMT voltage correlation coefficients are calculated for each laser detection deck during daily QC, resulting in standardized measurements across all lasers, detectors, and instruments. Standardization mode voltages can be adjusted synchronously or for each laser detection deck. The system supports standardization of Area and Height data. This unique capability allows scientists to obtain the best data at maximum PMT voltages and reduces the need to rerun single-color controls for every experiment. Standardization mode minimizes subjectivity and instrument variability to yield highly reliable, accurate, and reproducible results.
For Research Use Only. Class 1 Laser Product. Alexa Fluor is a registered trademark and eFluor and Pacific Orange are trademarks of Thermo Fisher. APC-R700 is a trademark of Becton, Dickinson and Company. CF is a registered trademark of Biotium. Cy is a trademark of GE Healthcare. PE/Dazzle, PE/FIRE, Spark NIR, and Zombie NIR are trademarks of BioLegend. All other trademarks are property of their respective owners.
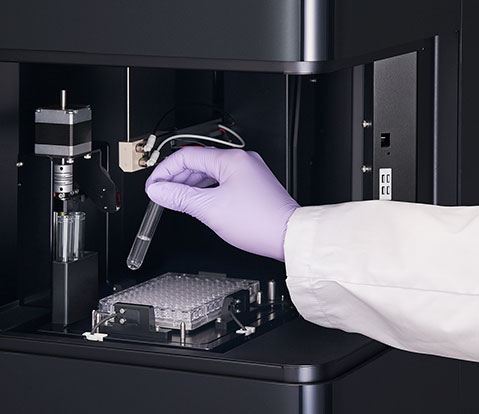
Automation is present across the workflow to simplify operation and ensure accurate results. To give scientists more efficiency in their day-to-day work, the ID7000 comes with an advanced, best-in-class AutoSampler, which supports 5-mL tube racks (24 tubes), 96-well standard height, 96-well half deep, and 96-well deep plates, and 384-well standard flat bottom plates. Samples can be cooled to 4°C (39°F) using a Peltier element to prevent signal degradation and reduce variability. The sample in the individual tubes or wells can be agitated at the beginning of acquisition, intermittently or continuously, enabling stable, long-duration acquisition without sample settling.
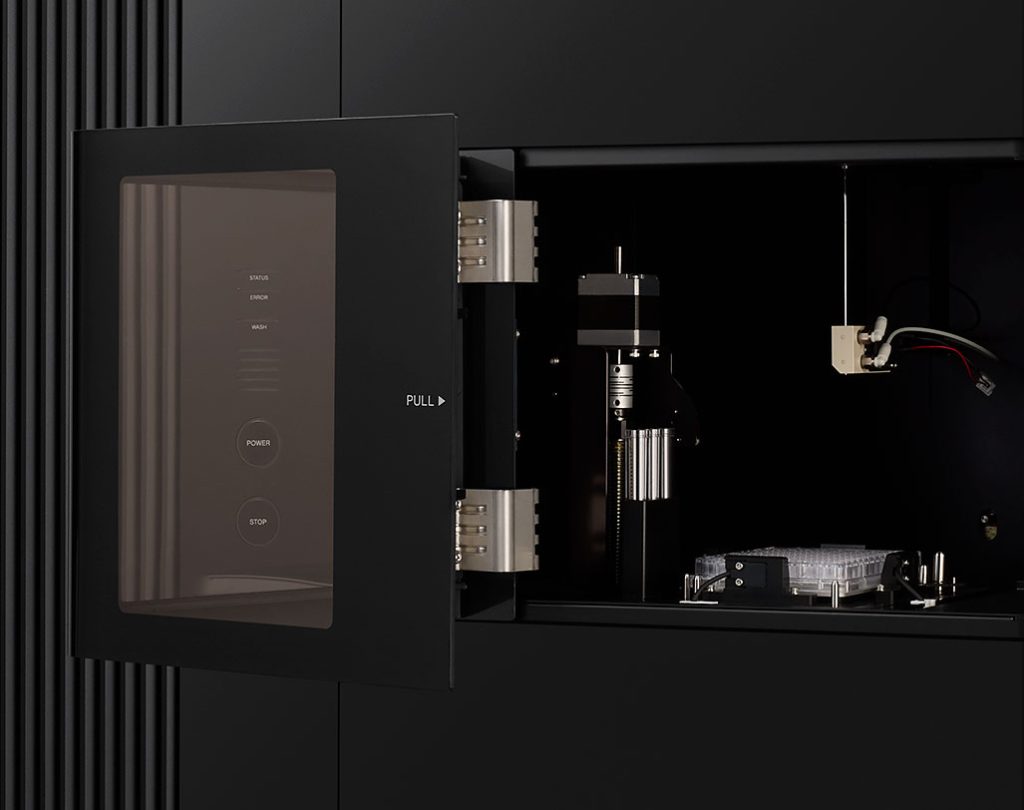
To ensure flexibility, the AutoSampler supports multiple wash options. A Dual Probe Wash option incorporates a cleansing mechanism that moves up and down to clean the inside and outside of the sample nozzle. Other wash options are available when speed of acquisition is the priority. The integration of intelligent software tools allows for management of bubbles and clogs, and integrated sensing mechanisms enable acquisition of critical samples at low volumes.
The AutoSampler is equipped with an extra loading station for added convenience. Up to three 5-mL tubes can be placed in the extra positions and used, for example, for loading QC particles to streamline system QC. Or, the wash and cleaning solutions can be loaded and the software programmed for the system to shut down automatically after acquisition is completed. This is invaluable for users performing multi-sample acquisitions that are time consuming.
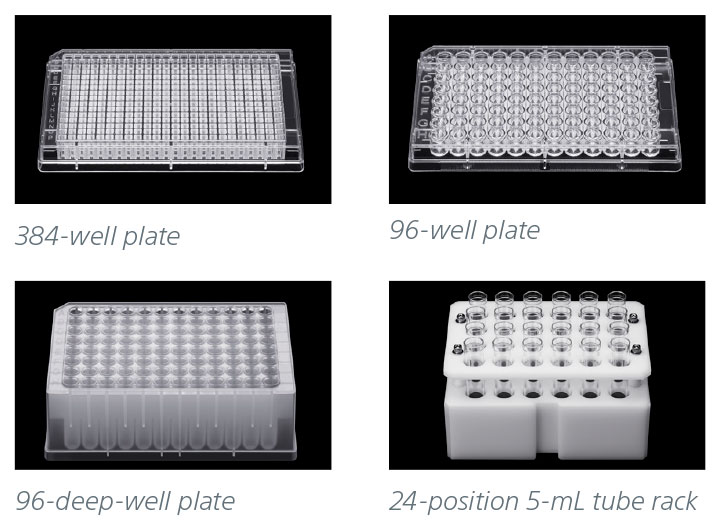
The ID7000 standard AutoSampler supports multiple loading options including a variety of 96-well and 384-well plates, as well as a 24-position tube rack for 12 x 75-mm (5-mL) tubes.
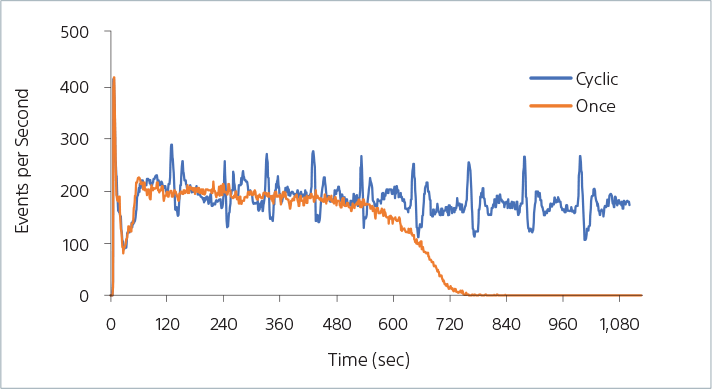
The ID7000 sample agitation feature is designed to keep large particles in suspension. The figure shows data with 30-µm particles when applying the initial mixing mode (Once) and the Cyclic mixing mode (Cyclic). It shows that the particles remain in suspension for 10 minutes when using the initial mixing mode, before there is an observed reduction in event rate. The Cyclic mixing mode, when used, continually mixes the sample throughout the entire acquisition, resulting in a consistent event rate with no settling.
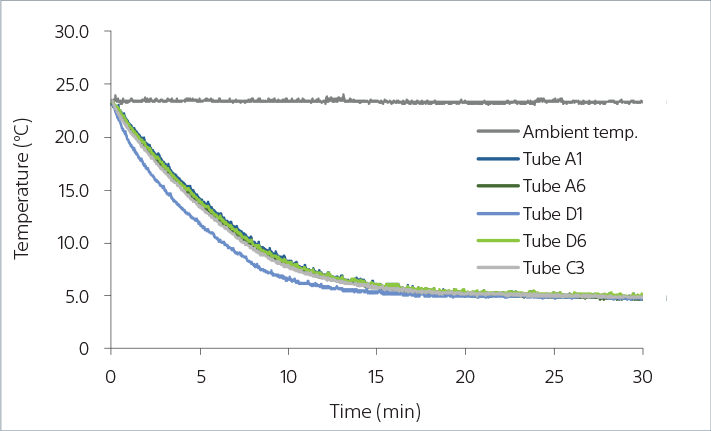
The graph above shows how sample temperature is maintained in the ID7000 AutoSampler when using a 24-position tube rack. Temperature measurement for tubes at multiple positions indicate that they maintain cooling over time when used in a 23°C ambient environment.
The ID7000 AutoSampler includes an extra tube station that accommodates up to three 12 x 75-mm (5-mL) tubes that can be used to support automated QC, system cleaning, and automatic shutdown workflows.
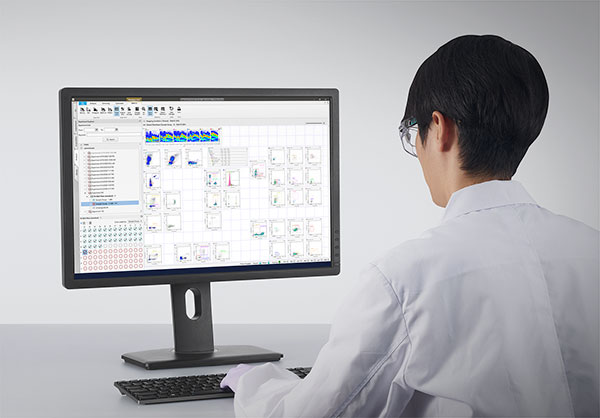
The ID7000 system software is easy to learn and use. It guides researchers from setup and QC to panel design, data acquisition, data analysis, through system shutdown. For accommodating users with varied experience levels, most workflows are designed with an expert mode and a guided mode. In guided mode, software wizards simplify system operation. The software provides access levels and tools to suit the needs of busy laboratories. Preferences allow users and administrators to specify options for overall instrument operation and experimental setup to facilitate use of the ID7000 spectral cell analyzer. It is also possible to configure software preference settings for each individual user for added convenience.
In the ID7000 system software, users can create experiments from a template, an existing experiment, a single-stained sample, or a multicolor assay to accommodate their preferred approaches. New users can create new experiments with the Experiment Design Wizard. To accommodate multi-sample and multiparameter experiment needs, the ID7000 software provides both a Shared Worksheet and an Individual Worksheet. A Shared Worksheet allows each sample in a group to use the same worksheet and thus makes experiment setup more intuitive.
Instrument settings can be specified for each sample group and configured for lasers and detectors to give researchers the needed flexibility. Altering these settings for a sample in a group changes the settings for all unmeasured samples belonging to the same group. Instrument settings can be exported and imported
as needed.
The acquisition functions are all accessible from the Acquisition tab and have been developed keeping a multi-laser workflow in mind. The tab accesses all functions that control the data acquisition, recording, and stopping, as appropriate, while monitoring the data acquisition status. To enable walkaway functionality, the system has an Event Checking function that can be set to stop or skip and continue automatic acquisition if the event rate drops or air bubbles are detected.
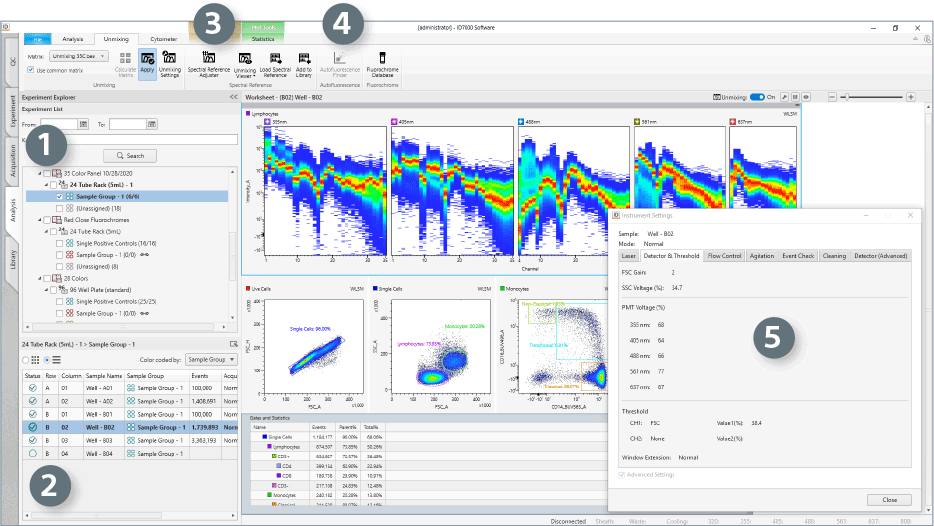
For sample analysis, the appropriate spectral references must be selected and fluorescence unmixing applied to remove the spillover components from each fluorescence channel. The unmixing can be manually adjusted on the screen using the Spectral Reference Adjuster. Making changes on one plot will result in the changes being applied automatically to all other plots having that fluorochrome as one of their parameters. Users can save the adjustment result as a new fluorescence unmixing matrix or can overwrite an existing fluorescence unmixing matrix.
The Analysis tab houses all controls for analysis operations on the ID7000 spectral flow cytometer, providing access to worksheet tools that let users choose how the data is displayed (such as plot types), and customize the display for their analysis needs. Plots and statistics provide real-time information during acquisition. The Experiment Explorer pane allows search by date and keyword, to display desired data on the worksheet. Once displayed, plots can be edited individually or as a group, to facilitate working with complex gating hierarchies.
The software also supports batch processes for users who need to run multiple samples, for operations like experiment setup, data acquisition and analysis, and export of data and statistics. Combined with the ability to program an automated shutdown, this enables scientists to focus on discovery instead of repetitive tasks.
At startup, the Align Check and Performance QC wizards use beads to check instrument calibrations, to ensure the instrument is operating optimally. On-screen instructions guide the user through procedures, then display progress and report results. The QC results are available as a report that can be shared and archived. Trends over a desired period of time can also be displayed to ensure that the system performance is consistent as expected.
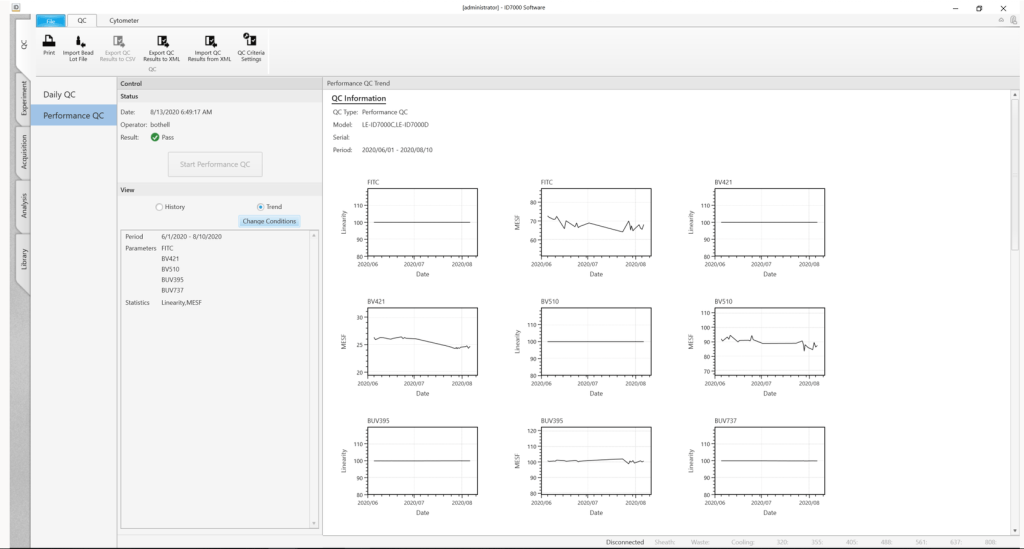
QC results for the system are tracked over time using the History and Trend views in the QC tab of the system software.
The History view displays the instrument performance results for each day, while the Trend view tracks instrument performance (such as linearity and MESF) over time as Levey-Jennings plots.
The Performance metrics are customizable and provide a convenient way to view performance results, spot trends, and measure variation over time, maintaining instrument settings for highly reproducible results.
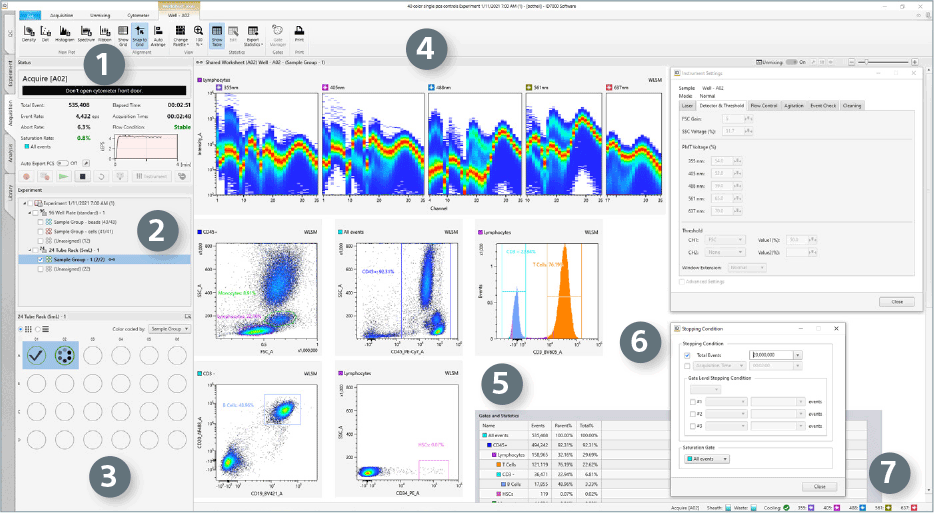
Selecting the Acquisition workflow tab displays information required for managing sample acquisition.
Source: sonybiotecnology.com
