The Sony SA3800 spectral cell analyzer incorporates advanced electronics and patented optical technologies to provide excellent analytical data. Its many automated features deliver true workflow simplicity.
Spectral technology in the SA3800 optimizes sensitivity and enhances dim signal detection by collecting photons at wavelengths from 420 nm to 800 nm. It also simplifies multicolor application design, workflow, and analysis for experienced and novice users.
Automation is present across all operations, from instrument startup, to quality control, acquisition, analysis, and system maintenance. Software wizards guide users through procedures across the workflow, making the system approachable for flow cytometry users of all levels.
SA3800 Spectral Analyzer Highlights
Uses spectral analysis technology to optimize sensitivity while simplifying application design and workflow.
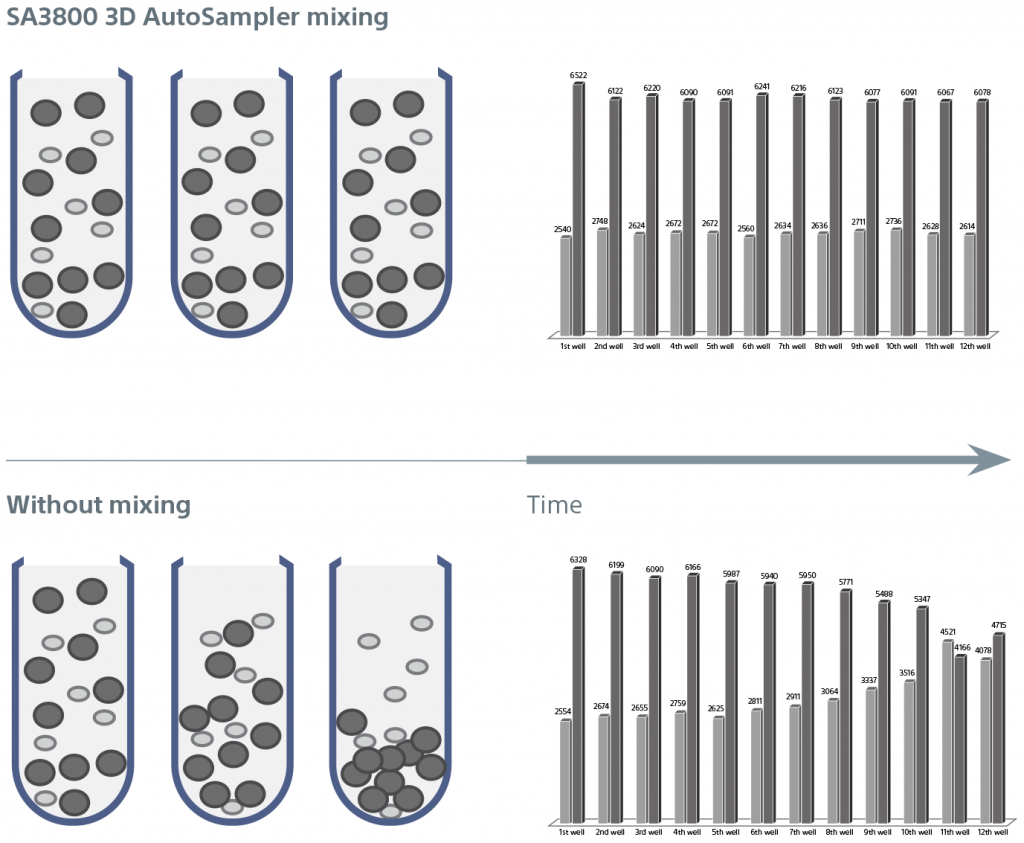
Unique 3D plate motion technology enables the plate (and sample) to move in horizontal and vertical directions to eliminate the need for cumbersome fluidics and their associated sample-to-sample cross-contamination. In addition, built-in, adjustable mixing mechanisms help maintain sample heterogeneity and optimal CVs between samples.
The SA3800 features automation across the workflow, including automated alignment and a software calibration wizard to simplify operation and improve the reliability of results.
For Research Use Only. Class 1 Laser Product.
System
SA3800 System Overview
The SA3800 spectral analyzer improves sensitivity and simplifies application design, workflow, and analysis over conventional flow cytometers. This is achieved using spectral analysis technology, automation throughout the system, advanced electronics, and patented optical technologies, unique to Sony systems.
Spectral Analysis Technology
Spectral analysis technology is the foundation of the SA3800 system. Spectral flow cytometry streamlines workflow and yields better data by collecting the entire visual spectrum of light. In conventional systems, overlapping fluorescence is subtracted using color compensation, so less light is collected. Instead, spectral flow cytometers sum the fluorescence together and then use unmixing to mathematically separate the colors. This powerful capability also simplifies workflow, including panel design, and improves visualization of autofluorescence.
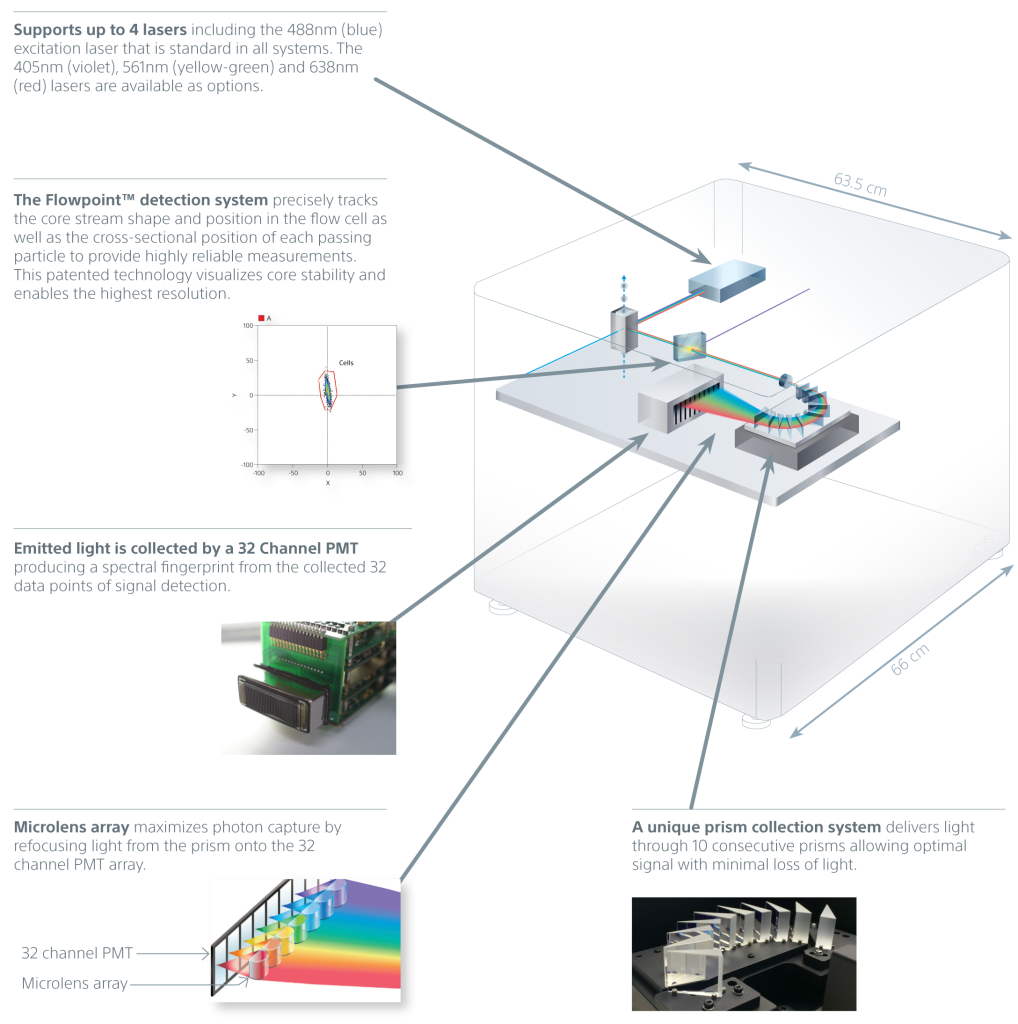
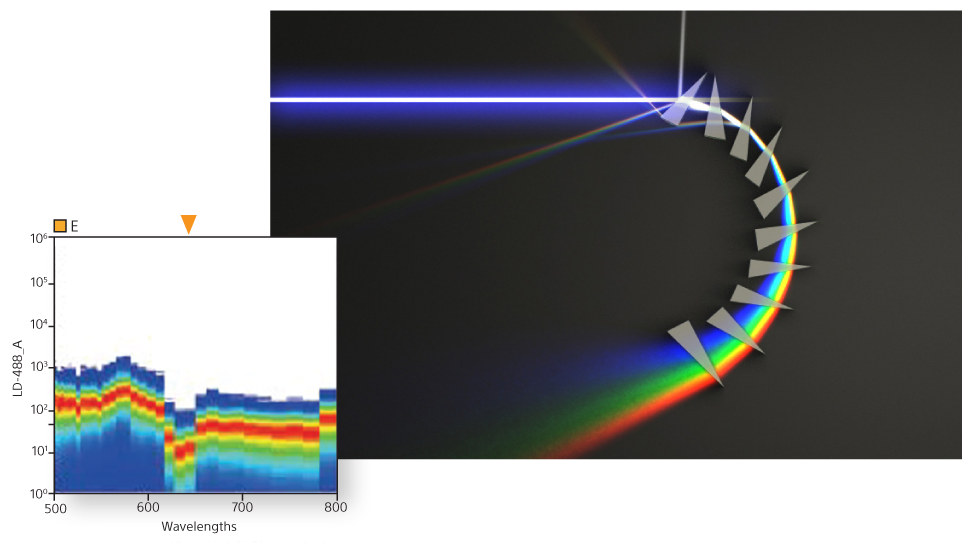
A unique prism collection system delivers emitted light to a 32-channel PMT. This produces 34 data points of signal detection for fluorescence and bright autofluorescence to achieve accurate visualizations of fluorescent populations. Researchers can see the complete spectral fingerprint of each fluorochrome from 420 nm to 800 nm.
Spectral Unmixing
A powerful capability of spectral technology is unmixing. This technique allows researchers to separate fluorophores into pure signals that measure the quantity of each fluorophore at each pixel to more accurately measure data for analysis.
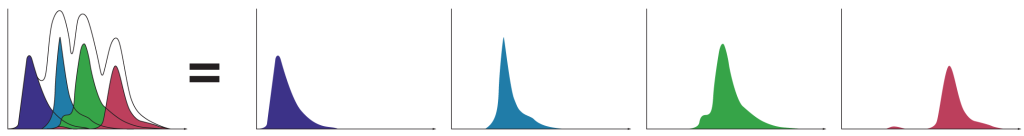
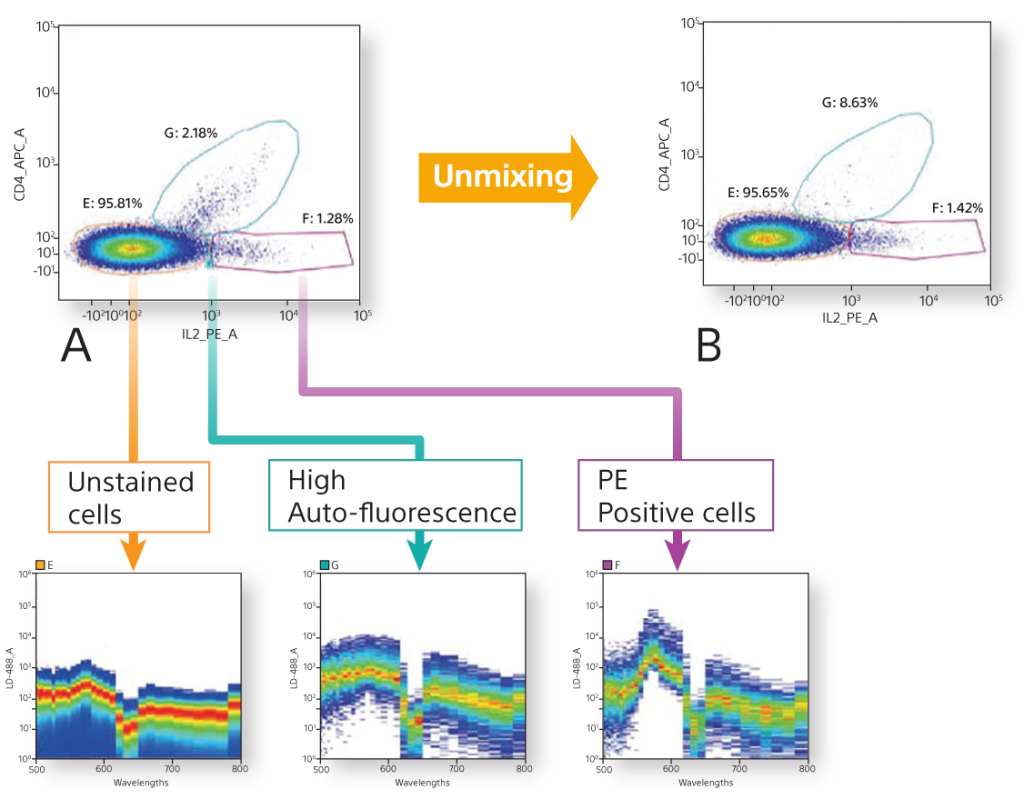
Spectral Unmixing separates each spectral fingerprint for complete and optimal visualization of fluorochromes
Spectral unmixing separates each spectral fingerprint to better visualize each fluorochrome marker. Unlike conventional filtering in which overlapping signals are lost, spectral unmixing captures the photons emitted from 420 nm to 800 nm. In doing so it enhances dim signal detection for better visualization of rare populations, fluorescent proteins, and fluorochromes excited by multiple lasers.
This also lets researchers separate the spectra of fluorophores masked by autofluorescence by extracting it from the signal and creating a unique autofluorescence parameter. With a clear signal for each color channel unaffected by overlapping signals (spillover) and autofluorescence, spectral analysis yields better, unbiased data for analysis.
Spectral analysis reduces false positives and delivers more accurate analysis over conventional flow cytometry. Mouse splenocytes were stained with CD4 APC and anti-IL-2 PE. A. In this conventional density plot, it is unclear if the light-blue region is a dim PE, weak double positive, or nonspecific binding. B. Using spectral analysis, the spectral data of each region is compared against the contents of the Spectral Library to unmix the sample. This reveals the light-blue region is high autofluorescence. Representative data collected on the Sony SP6800.
System Automation
Automation is present across the workflow to simplify operation and ensure accurate results. The system supports a wide variety of standard and deep-well plates, and 12 x 75-mm 5-mL tubes in the tube loader.
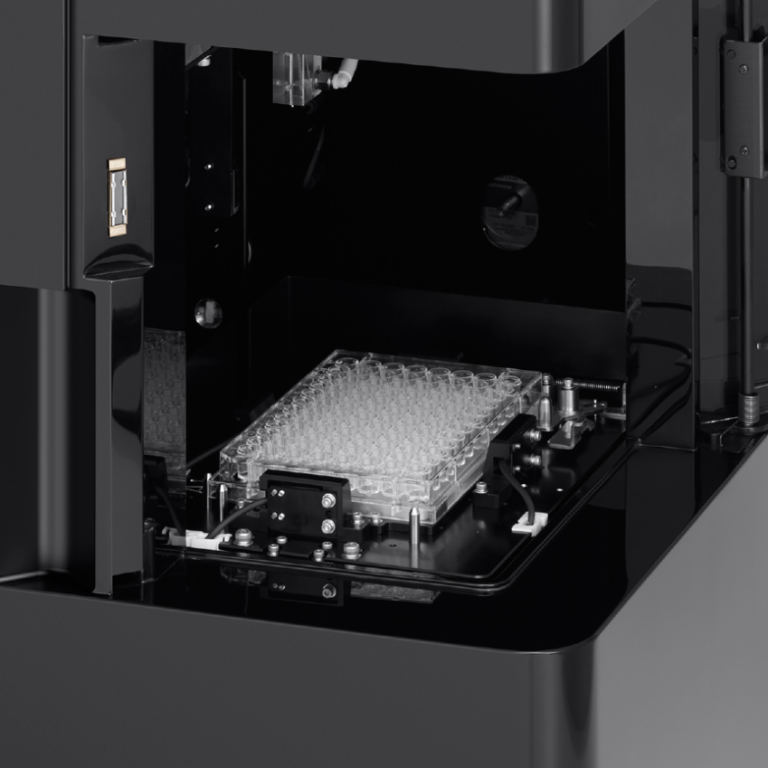
Novel 3D AutoSampler Technology
The novel 3D AutoSampler uses a fixed probe and moves the plate in horizontal and vertical directions to minimize sample-to-sample cross-contamination and speed up cleaning.
Sensors on the probe enable the system to accurately move the sample to the probe, calculate height of the tube or plate, and automatically recoil the probe if it touches the container or base plate surface. This unique design is aimed at reducing cross-contamination and clogs, and allows for automatic recovery when flow problems are encountered. It also enables faster cleaning between samples.
Plate motion uses a fixed probe and moves the plate (and sample) in horizontal and vertical directions.
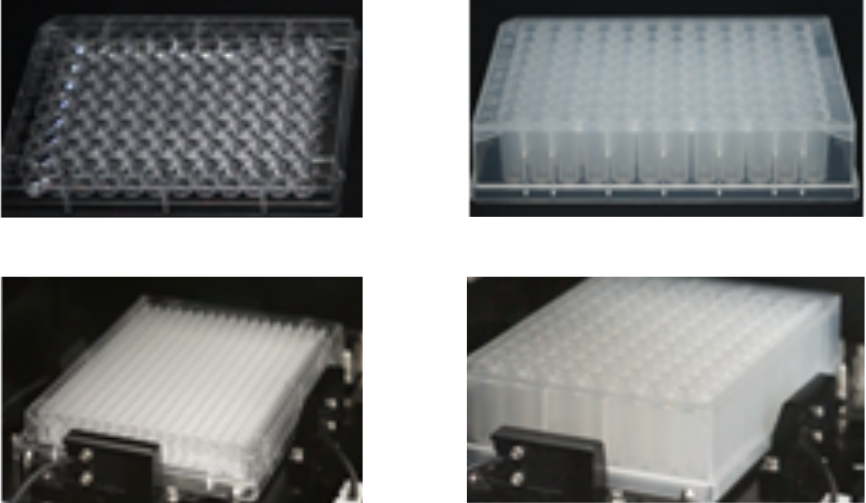
The SA3800 supports standard height and 96- and 384-well plates with round, flat, v- and conical shapes in addition to 96-well half deep and bottom plates.
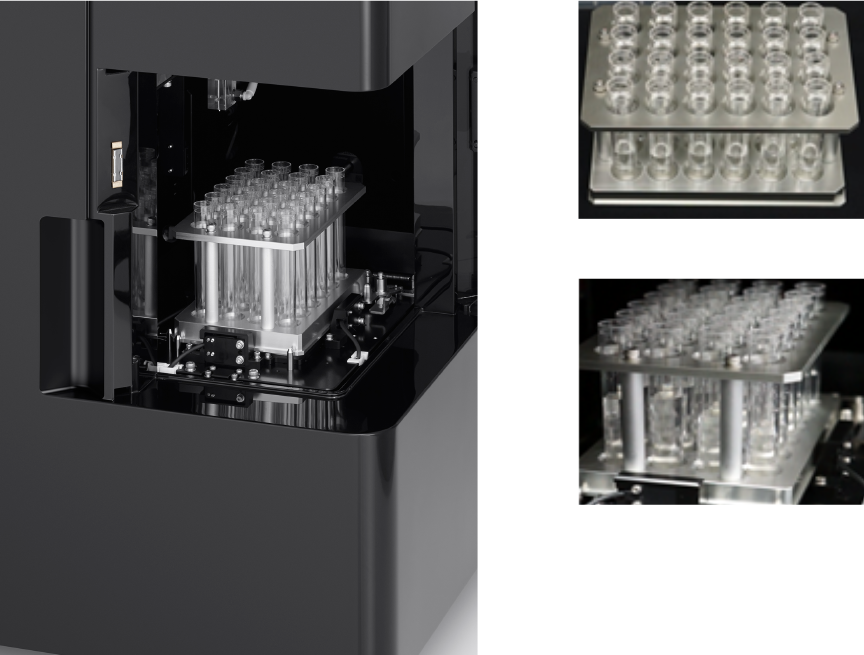
Tube Loader supports 5ml 12x75-mm tubes.
Mixing Automation and Cooling Plate
The 3D AutoSampler mixing function ensures consistent sampling throughout the acquisition of 96- or 384-well sample plates. Software optimizes settings for each plate type. Importantly, the mixing function maintains the integrity and heterogeneity of samples, ensuring that all particles are properly suspended for consistent results.
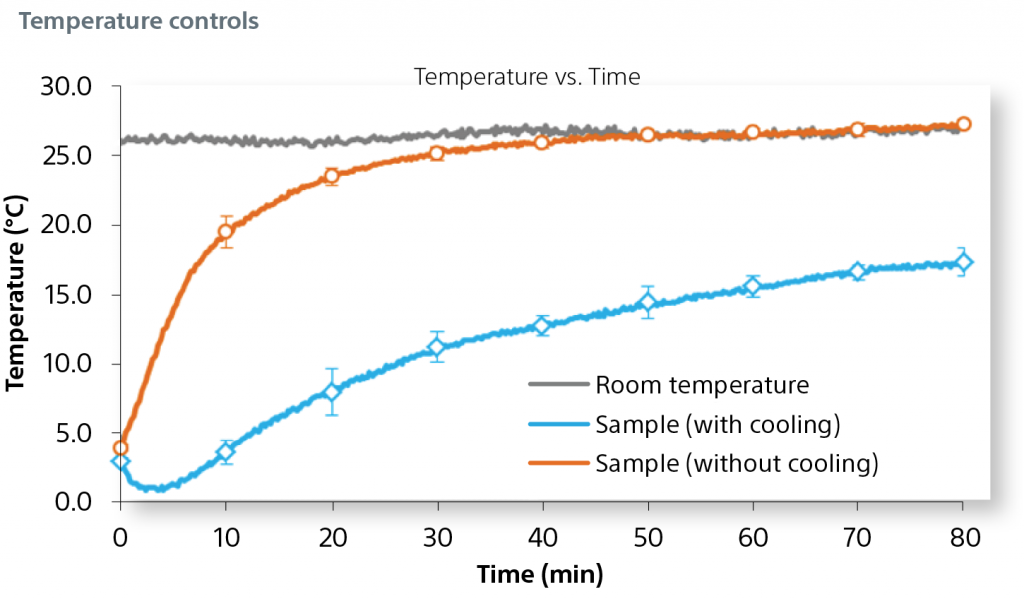
A cooling plate at the surface of the 3D base further reduces variability and inhibits sample degradation over time.
This figure illustrates how cell heterogeneity is maintained using the system’s 3D mixing function. Without mixing, larger cells settle to form heterogeneous samples, as shown in the lower illustration. Graph data describes how the sample integrity is maintained throughout plate acquisition of 3-µm and 10-µm beads from wells 1–96 to deliver more complete, consistent results.
The graph describes the impact of the cooling plate on sample temperature during a 80 minute plate acquisition.
Software
Software
The SA3800 software is easy to learn and use. It guides researchers from setup to panel design, acquisition, analysis, and shutdown.
User preferences allow operators and administrators to specify options for general instrument operation and how experiments are set up. These preferences promote ease of use and facilitate unattended operation procedures.
System Start Up
At startup, Align Check and Performance QC wizards check instrument calibrations, using beads to ensure the instrument is operating optimally. On-screen instructions guide the user through procedures, then display progress and report results. The performance report displays MESF, Q, and B values to describe real-time fluorescence detection performance. If desired, Align Check and Performance QC reports can be displayed in historical context.
Standardization
Standardization mode sets the system to a master specification to eliminate variability in a single instrument or among instruments located across sites. This unique capability allows experiments performed on any Sony cell analyzer to produce highly reliable, accurate and reproducible results. This function also eliminates setup subjectivity for collaborative or long term studies with different operators or experience levels across sites.
When engaged, standardization mode sets the SA3800 to predetermined global settings that eliminate instrument variability common in flow cytometers.
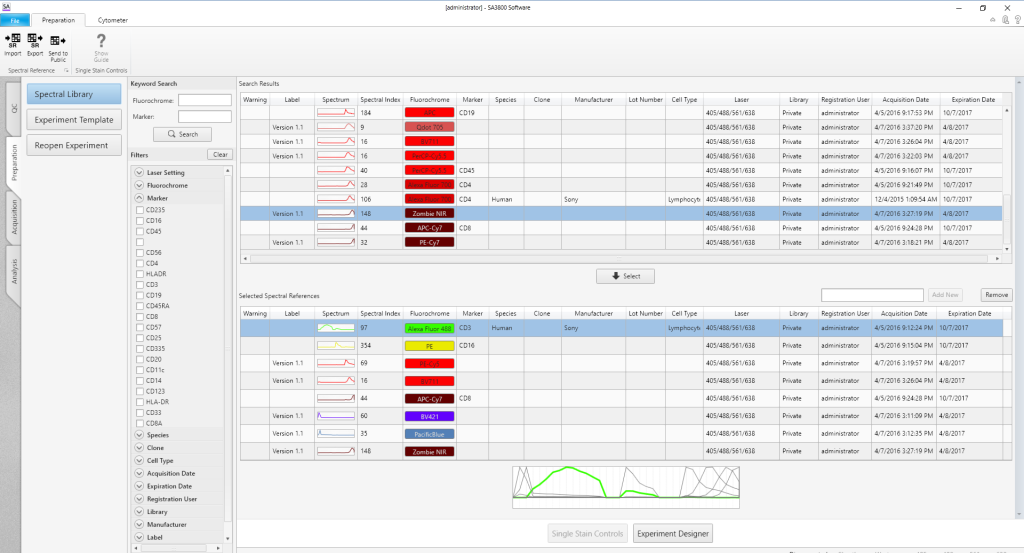
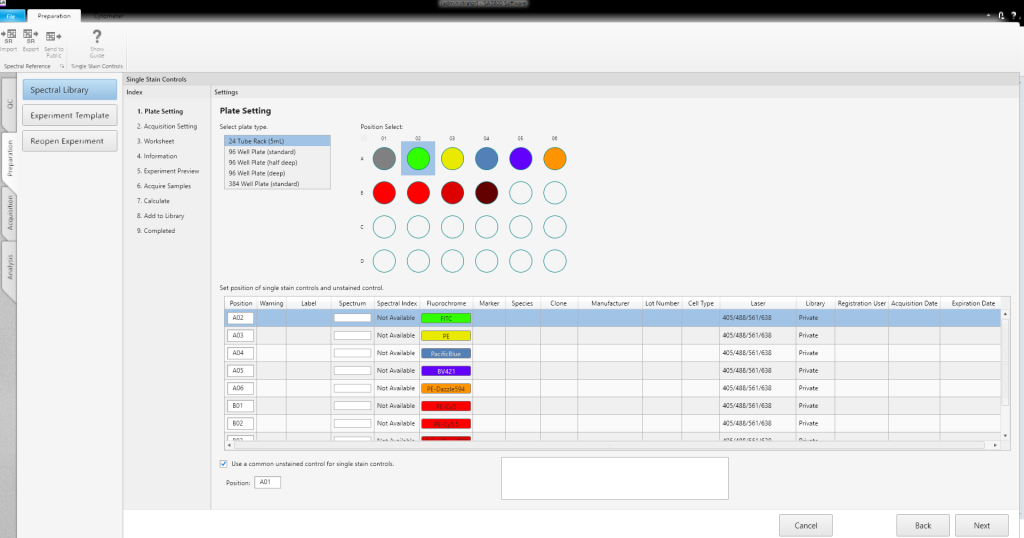
Spectral Library
The Spectral Library lets users create a personal reagent library that simplifies experiment creation and saves time. An Acquisition Wizard assists users with step-by-step instructions to acquire and analyze single-positive controls for the Spectral Library. Once acquired, the spectral reference for that reagent, including the spectral index, is available for future use. Information from the Spectral Library is available to users with a simple click, improving accuracy and streamlining panel design.
Experiment Creation
Experiments can be created using a template, an existing experiment, a single-stained, or a multicolor assay, in the Create Experiment window. Users can point and click to select (or edit) an existing experiment and can easily select templates for wells or plates when creating a new experiment. A setup Assay Wizard guides users through the creation of a single-stained or multicolor assay, simplifying experiment creation.
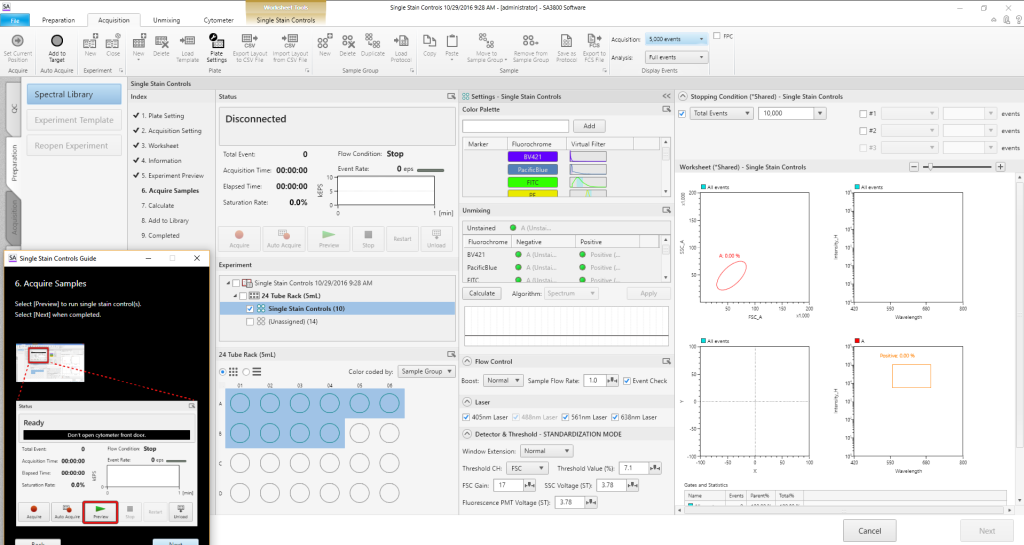
Acquisition Functions and Analysis
All acquisition functions, including instrument settings, are controlled from the Acquisition window. Worksheet tools let users choose how the data is displayed (such as plot types), and customize for their analysis needs. Plots and statistics provide real-time information during acquisition. To increase sample flow to the cuvette, a variable booster lets users set acquisition speeds from low (33 μL/min) normal, or high (250 μL/min) offering flexibility.
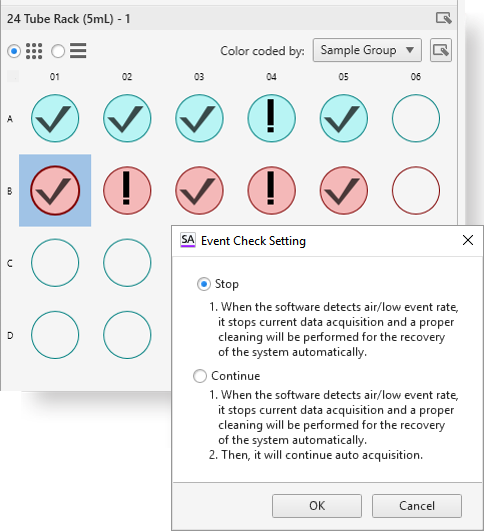
Walk Away Event Checker
To enable walk-away operation, the Event Checker monitors stream integrity to identify air bubbles or low event rates that might be produced by clogs. When an issue is identified, the Event Checker preferences can be set to either clear the clog and stop, or clear the clog and continue to the next sample. A tube/well map shows which tube or well had the issue.
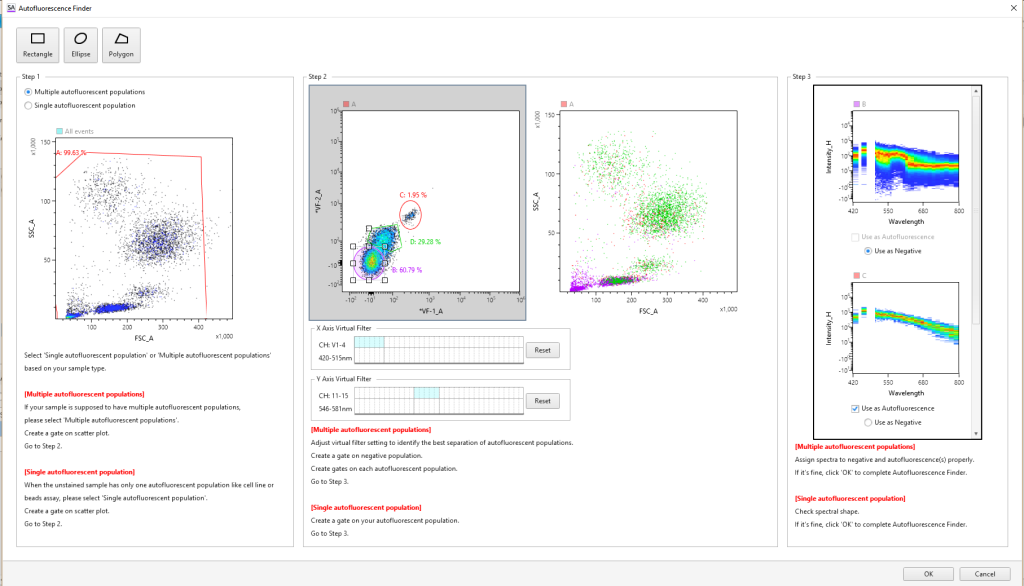
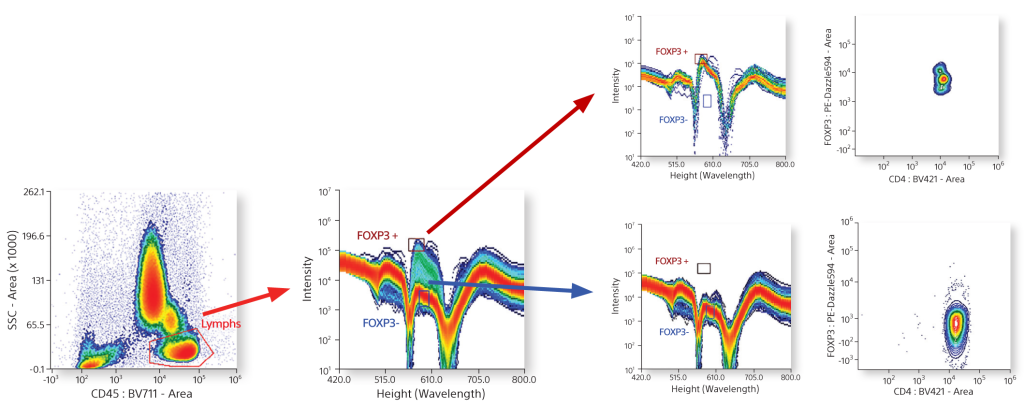
Autofluorescence Finder
In conventional flow cytometry, cellular autofluorescence produced by pyridine (NAD/NADH), flavin (FMN, FAD), and other intracellular oxidative reactions can cause fluorescence signal contamination in, for example, the FITC, PE, and Pacific Blue™ channels. Using the Autofluorescence Finder with spectral technology, autofluorescent spectral fingerprints can be easily found and subtracted to allow researchers to see the true fluorescent population.
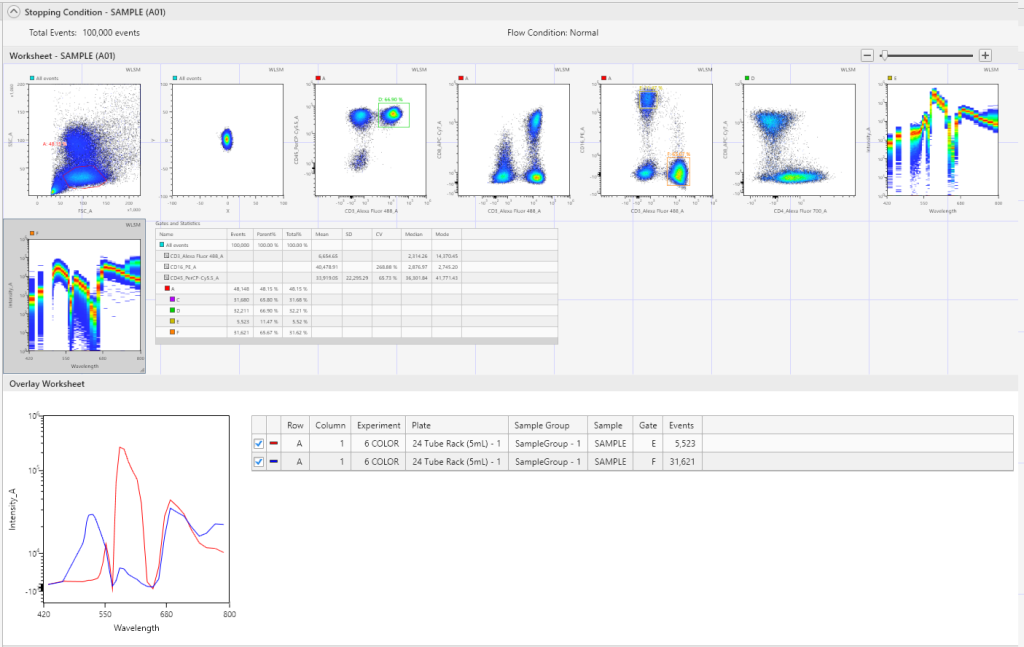
Spectral Overlays
Comparative spectral curves can be created by using the Spectral Overlays function, to help identify unique populations between individual tubes/wells in the same or different experiments.
System Shut Down
On shutdown, the SA3800 software guides the user though pre–shutdown cleaning and shuts down the instrument automatically. Software wizards are also available to guide users through Bleach Cleaning and Rinse procedures.
FCS Express from De Novo Software
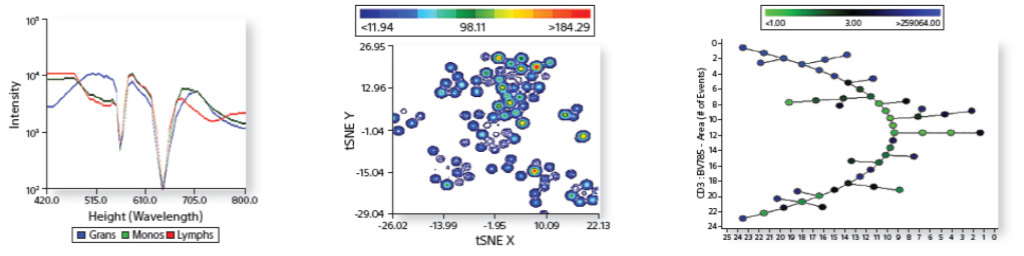
Spectral analyzers from Sony include FCS Express, from De Novo Software. FCS Express offers a range of new analysis tools from live gating to batch analysis. Native support for Sony spectral data files enables sophisticated data transformations and visualizations such as spectral overlays, tSNE, Spade, and heat maps.
Live Gating
Dot plots and spectral plots can be set up with live gating. Live gating allows users to find positive and negative populations quickly and easily for added assurance about target populations.
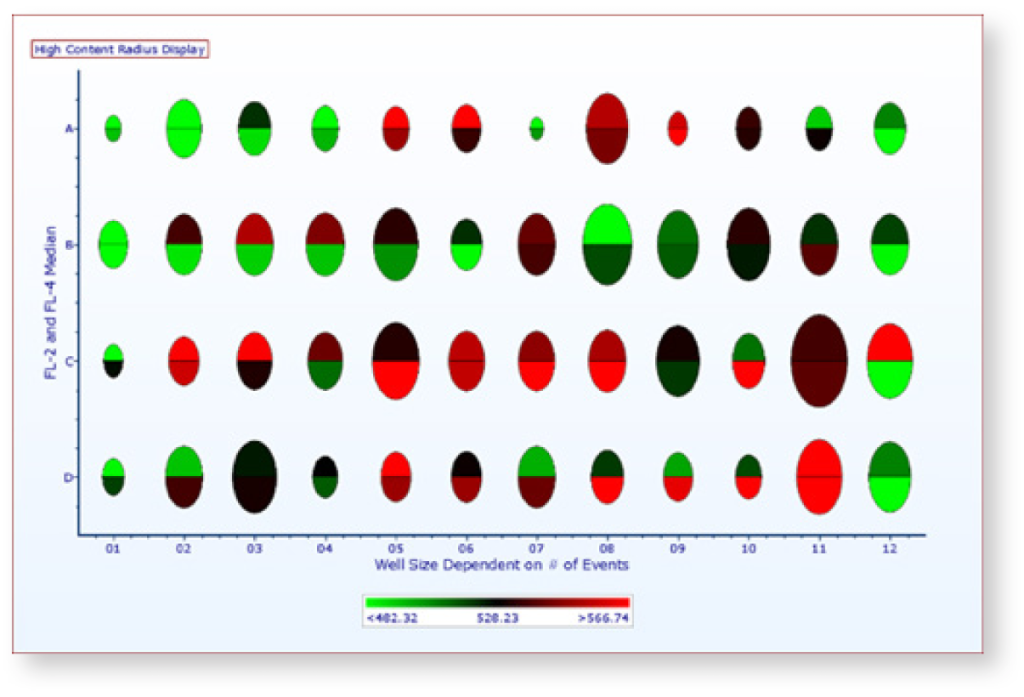
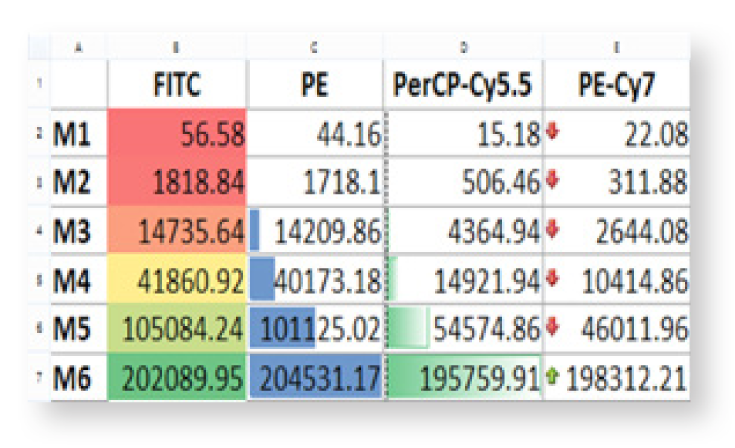
Plate and High Content Analysis
Import plate or high content screening data and transform it into heat maps, overlays with radius visualization, and parameter statistics.
Flexible Analysis
Flexible data analysis can include integrated spreadsheets, custom calculations, charting, and regression analysis.
Expanded Data Visualization
Spectral, FCS, and CSV files are read directly by the software to enable more in-depth visualization of data.
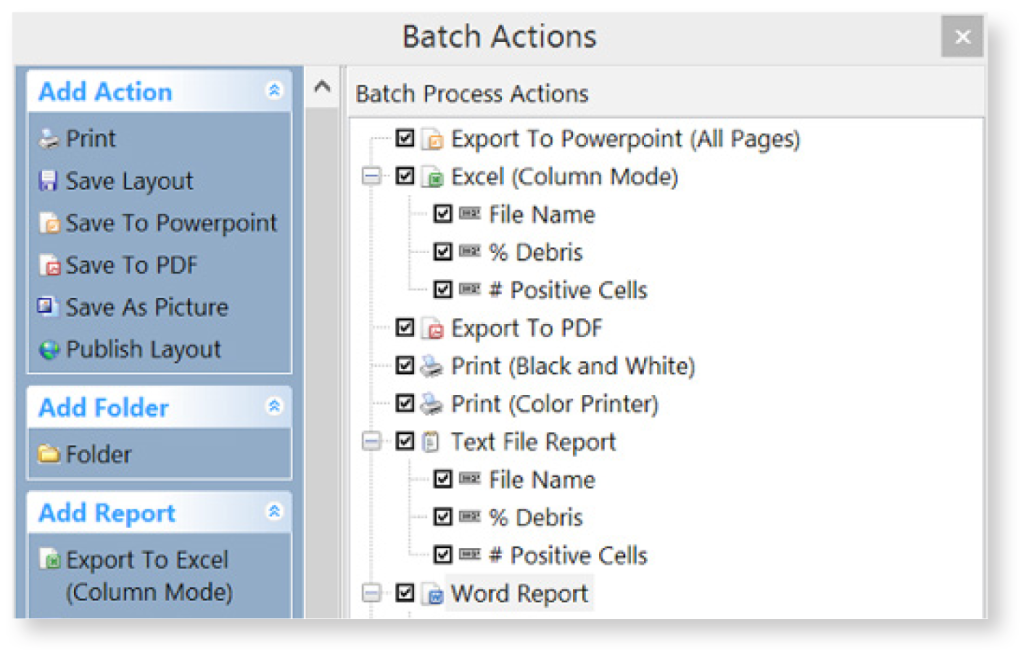
Batch and Report
Batch analysis lets users process any number of samples quickly and easily with one click. To support presentation, data can be exported directly to PowerPoint, PDF, and Excel.
Sample Data
Using spectral unmixing, the SA3800 allows maximum flexibility for fluorochrome selection. Results are comparable to those obtained using conventional systems.
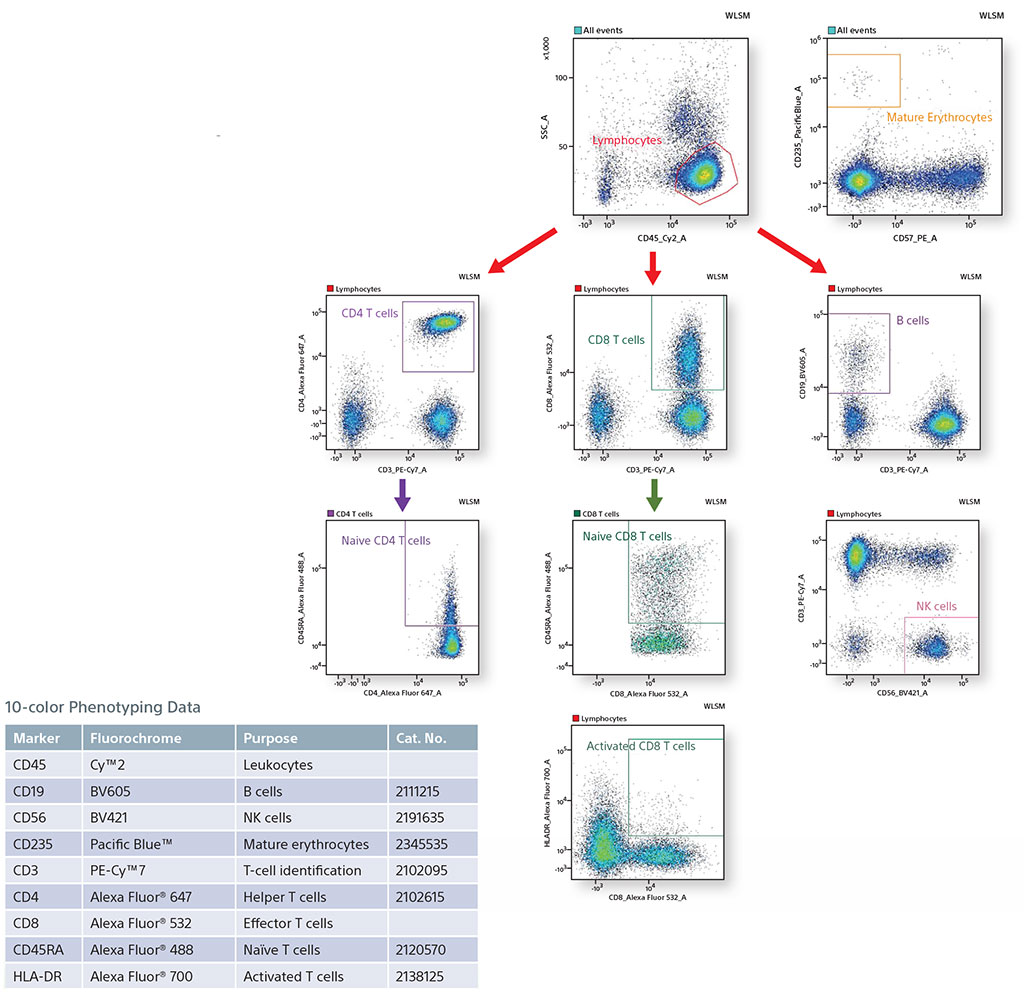
10-color Phenotyping of Human TBNK and Mature Erythrocytes using 3 Lasers
In this panel, all lymphocytes were identified by staining with CD45. From the CD45+ population, B cells (CD19), NK cells (CD56), and T cells (CD3) were identified. In addition, mature erythrocytes were identified using CD235. The T-cell population was further analyzed to find effector T cells (CD8) and helper T cells (CD4). These T-cell populations were analyzed to find subset populations, Naïve CD4 and CD8 T cells, and Activated CD8 T cells using HLA-DR and CD45RA.
Fixed human whole blood was stained with 10 colors and analyzed on an SA3800 with 405-nm, 488-nm, and 638-nm lasers. Populations were gated on forward (FCS) and side scatter (SSC), then CD45+. From that population, several subsets were identified.
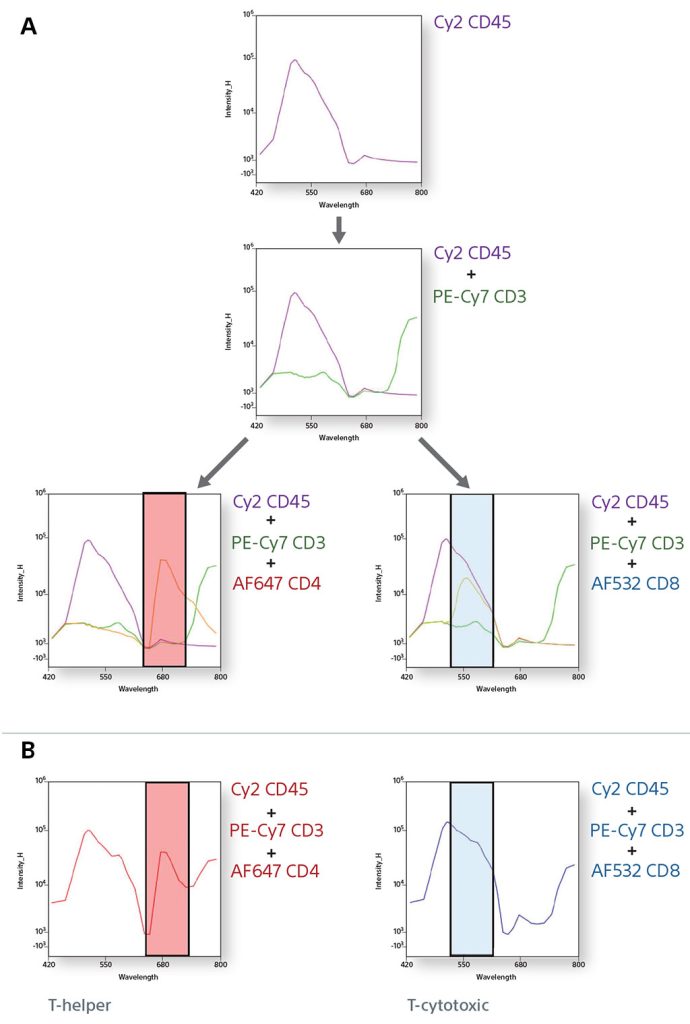
Figure A shows single positive control overlays of the spectral curves for CD45, CD3, CD4, and CD8 from a human TBNK sample. When compared to the TBNK sample (Figure B), the single positive control overlays match. CD4 Alexa Fluor® 647 and CD8 Alexa Fluor® 532 are used to distinguish the presence of T-helper cells and T-cytotoxic cells in the sample.
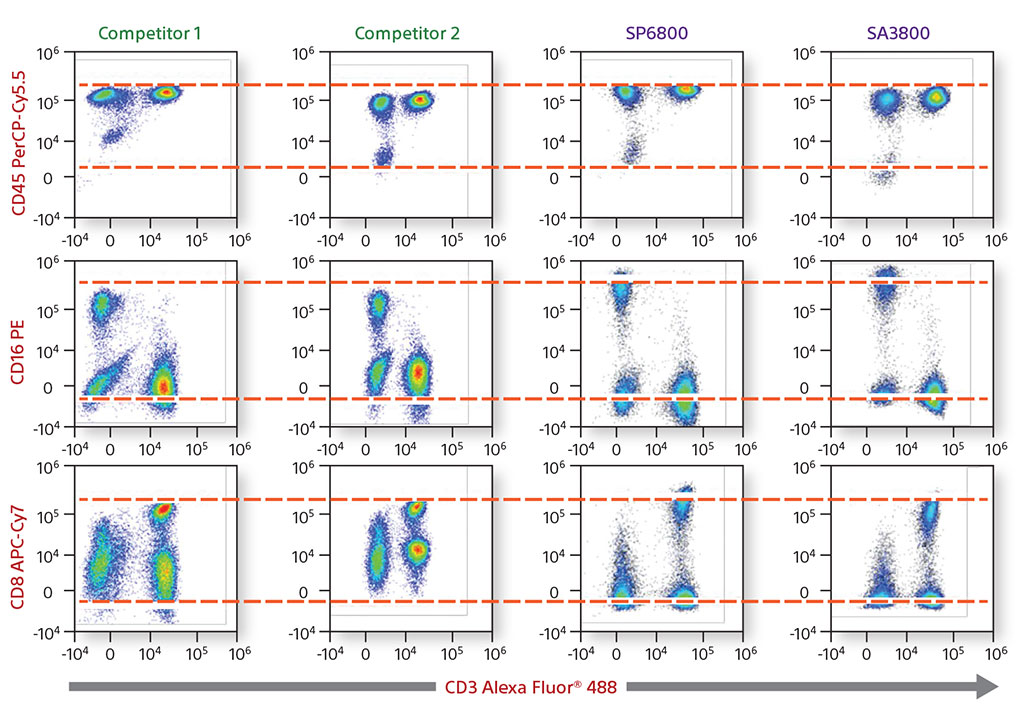
Comparative Data on Human Lymphocytes
A four-color comparative analysis of fixed human lymphocytes was done to evaluate resolution and sensitivity. The same sample was used on the same day on four different instruments. Each instrument had the recommended cleaning and instrument QC performed before running the sample. When compared with competitors, the Sony SA3800 and SP6800 spectral analyzer results showed better separation between the negative and positive populations.
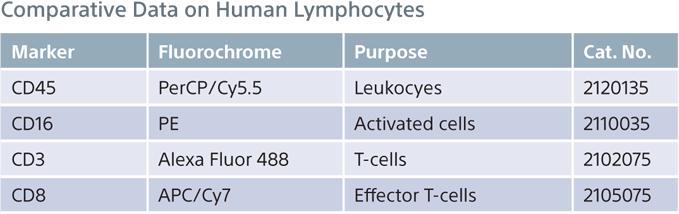
In addition, a comparison was performed of the removal of autofluorescence. Each instrument showed autofluroescent populations stemming from the negative population. The SA3800 was able to identify the population, create it as its own color using the Autofluorescence Finder, and subtract the populations to allow the user to see the true populations.
4-Color Comparative Data on Human Lymphocytes
Comparative Data with Autofluorescence Removal
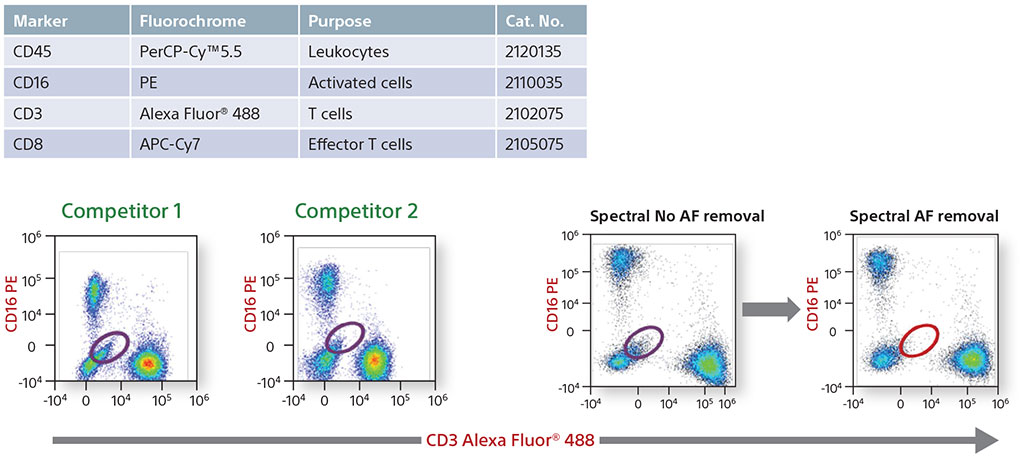
Using 10 Colors with 405-nm and 488-nm Lasers to find Multiple Populations
In an experiment using fixed human blood, B cells (CD19), macrophages (CD33), basophils (CD123), NK cells (NKp46), and helper T cells (CD45/CD3/CD4) were identified. Also, a smaller subset population of NKT cells was analyzed using CD57. CD57 shows expression mostly on negative CD4 cells, since it is associated with CD8 killer T cells.
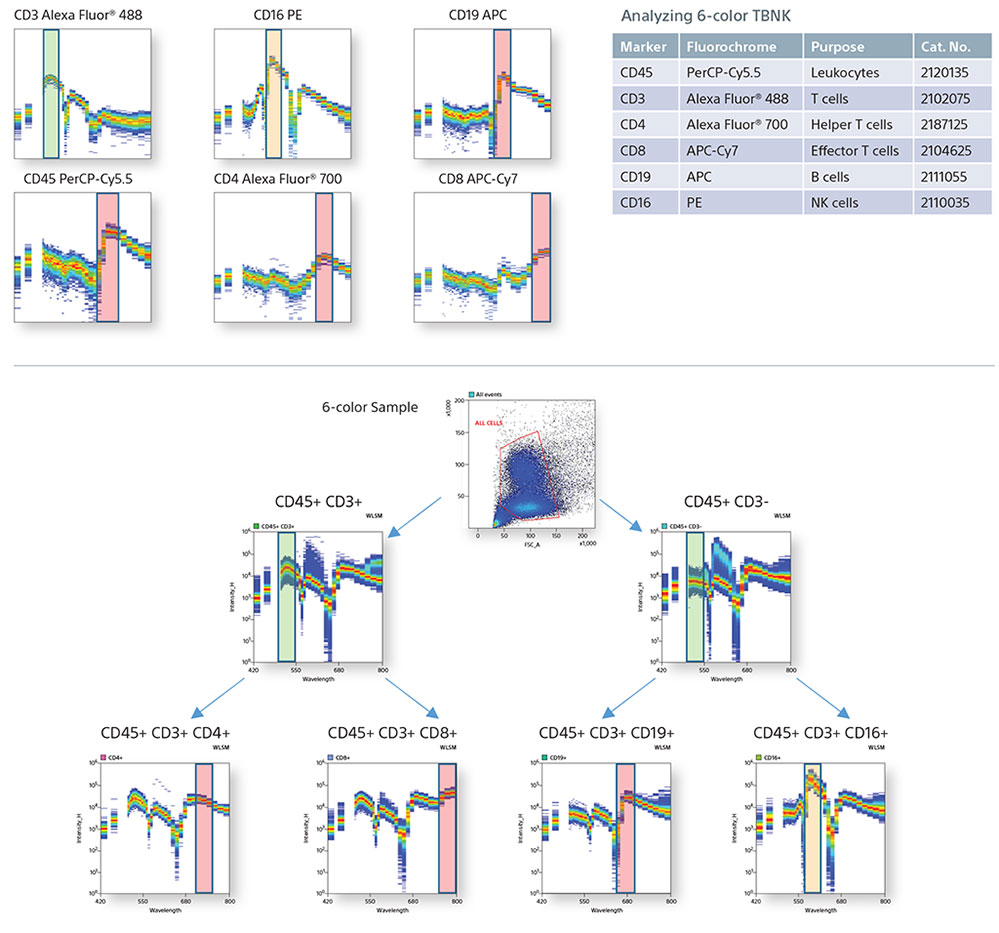
Spectral Fingerprinting using a TBNK panel
Cytometrists use many forms of controls to determine cell populations from a heterogeneous mixture of cells. In this example, a 6-color TBNK panel was analyzed completely by spectral fingerprints. By comparing the single positive spectral fingerprints, the need for an FMO control to identify a population is decreased. In addition, since the autofluorescence from the unstained cells is treated as a separate color, it is subtracted to be able to identify the cellular lineage easily.